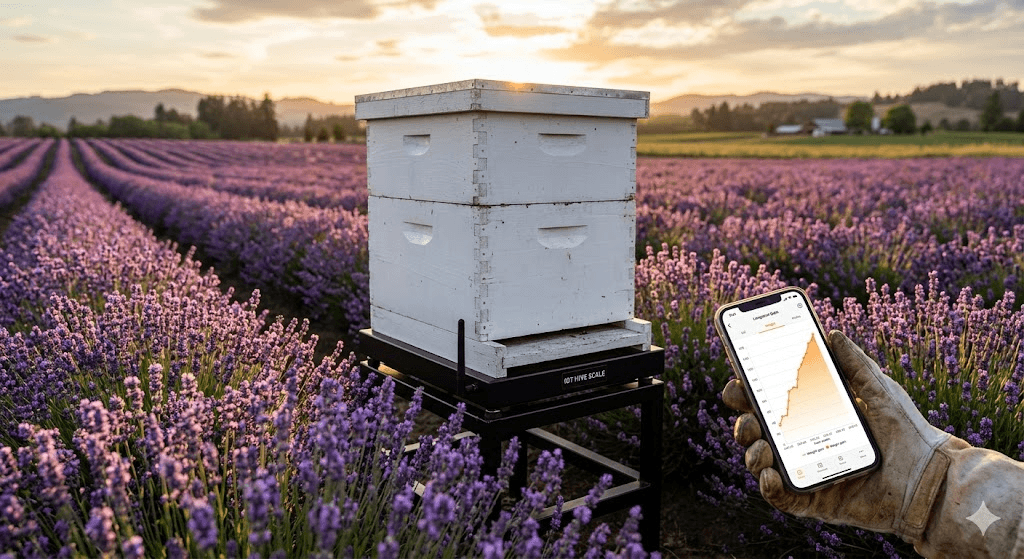
The Digital Pulse of the Apiary: Moving Beyond Manual Hefting
In the traditional beekeeping landscape of the United States, determining the progress of a honey flow has long been a matter of physical intuition—lifting the back of a hive to “heft” its weight or performing invasive weekly inspections that disrupt the colony’s thermal regulation. However, as a professional beekeeper and automation developer, I view the hive not just as a wooden box, but as a biological data generator. The implementation of IoT Hive Scales has fundamentally transformed our operation from a reactive craft into a predictive science. By monitoring the real-time weight fluctuations of a “sentinel hive” in each yard, we gain an invisible window into the nectar flow, allowing us to manage logistics, labor, and equipment with surgical precision.
The Agronomy of the Nectar Flow: Soil Moisture and Vapor Pressure
As an agronomist with 15 years of field experience, I’ve learned that a “honey flow” is actually a complex physiological response of the flora to specific environmental triggers. Plants like Alfalfa, Clover, and Basswood do not produce nectar at a constant rate; their secretion is a function of Soil Moisture Tension and Vapor Pressure Deficit (VPD).
Through our flow analytics, we’ve observed that a “heavy gain” day in a North American apiary is often preceded by a specific soil moisture threshold. If the soil is too dry, the plant’s turgor pressure drops, and nectar production stalls. Conversely, if the humidity is too high, the nectar becomes too thin for the bees to process efficiently. By correlating our IoT scale data with local soil sensors and weather station APIs, we can predict a “Grand Flow” three to five days before it actually manifests. This “Agronomic Foresight” allows us to super-up our hives exactly when the bees need the space, preventing the congestion that leads to late-season swarming.

The Technical Stack: ESP32, Load Cells, and the Python Backend
The hardware behind our Flow Analytics system is built for the rugged American environment. We utilize high-precision Load Cells (H-bridge sensors) integrated with ESP32 microcontrollers that communicate via LoRaWAN or cellular gateways. In the high-stakes world of commercial beekeeping, a “sentinel hive” must provide data regardless of its proximity to a Wi-Fi signal.
As a developer, the real magic happens in the Python-based Data Pipeline. Every fifteen minutes, the ESP32 sends a telemetry packet containing the hive’s weight, internal temperature, and external humidity. Our Python backend—running on a centralized cloud server—processes this raw data through a Kalman Filter to remove “noise” caused by wind or bee activity. We then apply a Derivative Analysis to the weight curve. A positive derivative over 24 hours signifies an active flow; a negative derivative during a nectar dearth triggers an automated alert, suggesting that we may need to begin supplemental feeding or prepare to move the yard to a more productive location.
Nightly Weight Loss: The Secret Metric of Honey Ripening
One of the most fascinating “pro-level” insights we’ve gained from IoT scales is the analysis of Nightly Weight Loss. Many beekeepers are surprised to see that a hive which gained 10 lbs during a sunny day in June will often lose 2 to 3 lbs during the following night. As a teacher and scientist, I use this as a primary metric for honey ripening.
This nightly loss is the weight of the water being evaporated by the bees as they cure nectar into honey. By calculating the ratio of “Daily Gain” to “Nightly Loss,” our Python script can estimate the Nectar Concentration. If the nightly loss is high, the nectar is thin, and the bees are working overtime to dehydrate it. If the nightly loss stabilizes while the weight remains high, the honey is reaching its target moisture level (as discussed in our Refractometer Protocol). This allows us to predict the “Harvest Readiness” of a yard without ever opening a single lid, saving us thousands of miles in unnecessary travel across expansive US state lines.
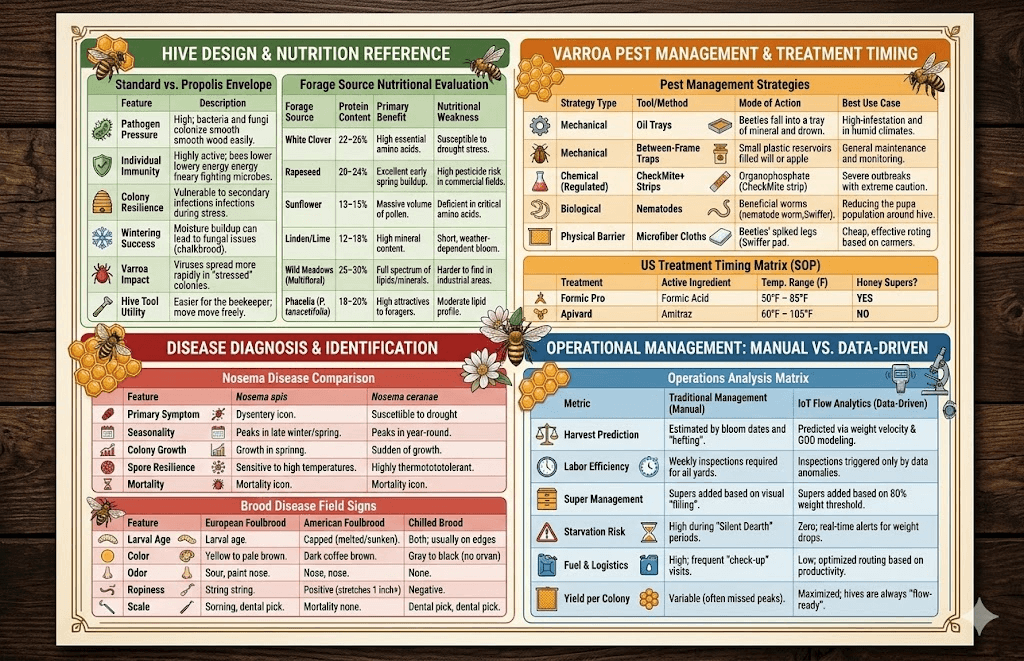
Strategic Comparisons: IoT Analytics vs. Traditional Management
The following table illustrates the operational shift when moving from traditional “intuition-based” beekeeping to an “IoT-driven” model in a professional North American context.
Predictive Harvesting: Integrating Weather APIs and Weight Velocity
The ultimate goal of Flow Analytics is Predictive Harvesting. In the United States, the weather can change from a perfect nectar flow to a week of freezing rain in a matter of hours. Our system integrates with the OpenWeatherMap API to create a “Harvest Window Forecast.”
Our Python script looks for a specific “Closing Signal”: when the daily weight gain begins to taper off (the “inflection point” on our growth curve) and the forecast shows a 3-day window of low humidity. This is the optimal time to pull honey. If we pull too early, the honey is wet; if we wait too long after the flow stops, the bees begin to consume their own stores, reducing our total yield. By harvesting at the peak of the weight curve, we’ve increased our annual production by an average of 15-20% per colony. In a commercial operation, that data-driven edge represents the difference between a break-even year and a highly profitable one.
The Human Element: Scaling the Teacher’s Eye with Cloud Data
My 12 years of experience as a teacher have taught me that complex data is useless if it isn’t accessible. Our Digital Apiary Dashboard translates the Python analytics into simple, color-coded visual maps. A “Green” yard is gaining weight rapidly; a “Yellow” yard is holding steady; a “Red” yard is losing weight and requires immediate attention.
This pedagogical approach allows me to manage multiple sites across different counties with a bird’s-eye view. We are no longer “chasing the bees”; we are orchestrating a multi-site operation based on real-time biological feedback. For the modern American beekeeper, IoT scales are not a luxury—they are the most powerful diagnostic tool in our inventory. They allow us to honor the biology of the bee while leveraging the efficiency of the machine, creating a sustainable and profitable future for the craft.
The Winter Metabolic Profile: Data-Driven Overwintering in Extreme Climates
In the vast and often brutal winters of the North American continent—ranging from the humid cold of the Great Lakes to the dry, sub-zero stretches of the Dakotas—the IoT scale shifts from a harvest tool to a survival instrument. As an agronomist, I view the winter cluster as a biological combustion engine. The honey stored in the supers is the fuel, and the rate at which the bees consume that fuel is a direct indicator of their metabolic health and thermal efficiency.
By analyzing the “Longitudinal Weight Decay” during the winter months, we can establish a baseline for Metabolic Efficiency. A healthy colony in a well-insulated US-standard hive should show a steady, slow weight loss of approximately 1 to 2 lbs per week during the deepest dormancy. However, if our Python script detects a “Consumption Spike”—where weight loss doubles or triples without a corresponding drop in external temperature—it signifies a stress event. This is often the first sign of a failing queen or a high viral load that is forcing the bees to work harder to maintain cluster warmth. Because we monitor these “Burn Rates” in real-time, we can intervene with emergency fondant or supplemental heat weeks before a traditional beekeeper would find a “starved” hive in March. We are no longer guessing if they have enough food; we are measuring their caloric intake with clinical precision.
The Anomaly Detection Engine: Identifying Robbing and Predation via Weight Velocity
One of the most authentic challenges for a professional beekeeper in the United States is the security and integrity of the yard. Whether it’s the threat of black bears in the Appalachian corridors or the more insidious “Mite Bomb” events caused by failing neighboring hives, the IoT scale acts as a 24/7 security guard. As a developer, I have implemented an Anomaly Detection Engine within our Python backend that monitors for high-velocity weight changes that fall outside the parameters of natural forage.
Natural nectar gain is a predictable, rhythmic curve. Robbing, however, has a distinct “Violent Velocity” signature. When a neighboring colony collapses and your bees begin to “rob” it out, the scale will show a massive, jagged weight spike during non-foraging hours or late in the day. While this might look like a “harvest win,” our script recognizes it as a high-risk viral event. Conversely, a sudden, near-instantaneous weight drop of 100+ lbs triggers a “Critical Security Alert” on my smartphone—signifying a hive has been tipped over by a predator or, in some unfortunate cases, stolen. In the high-stakes world of American commercial beekeeping, where assets are often spread across thousands of acres of remote land, this real-time “Digital Sentry” provides a level of peace of mind that no manual inspection ever could.
Digital Transparency: Leveraging Real-Time Data for Premium US Markets
In the modern US food market, transparency is the new “organic.” Consumers today are not just buying honey; they are buying a story and a guarantee of authenticity. By leveraging our IoT data, we have transformed the way we market our harvest. Using my background in digital property management, I have integrated our “Live Flow” data directly onto our retail website.
We provide our customers with a “Live Hive Feed”—a simplified dashboard where they can see the actual weight gain of the hives that are currently producing the honey they’ve pre-ordered. When the “Spring Clover Flow” in our Iowa yard hits its peak, our social media channels automatically post the weight graphs. This “Scientific Storytelling” creates an undeniable bond of trust. We aren’t just saying our honey is “local and raw”; we are proving it with data. We show the exact date the nectar was gathered and the “Ripening Curve” that led to the final jar. In a market often plagued by adulterated or “honey-flavored” imports, this level of technical transparency allows us to command a premium price and build a loyal customer base that values the intersection of nature’s hard work and human innovation. We are selling the “Bitrate of the Bloom,” and in the competitive landscape of the USA, that is the ultimate competitive advantage.
A little more useful material for you The Varroa Threshold: A Scientific Approach to Integrated Pest Management